Tutorial 3 of 6
~3 minBuild a dashboard
Turn raw readings into number cards, gauges, charts, LEDs and maps.
- 1
Click “Add widget”
On the Dashboard, click Add widget. Widgets are grouped into Display (show data) and Control (send commands).
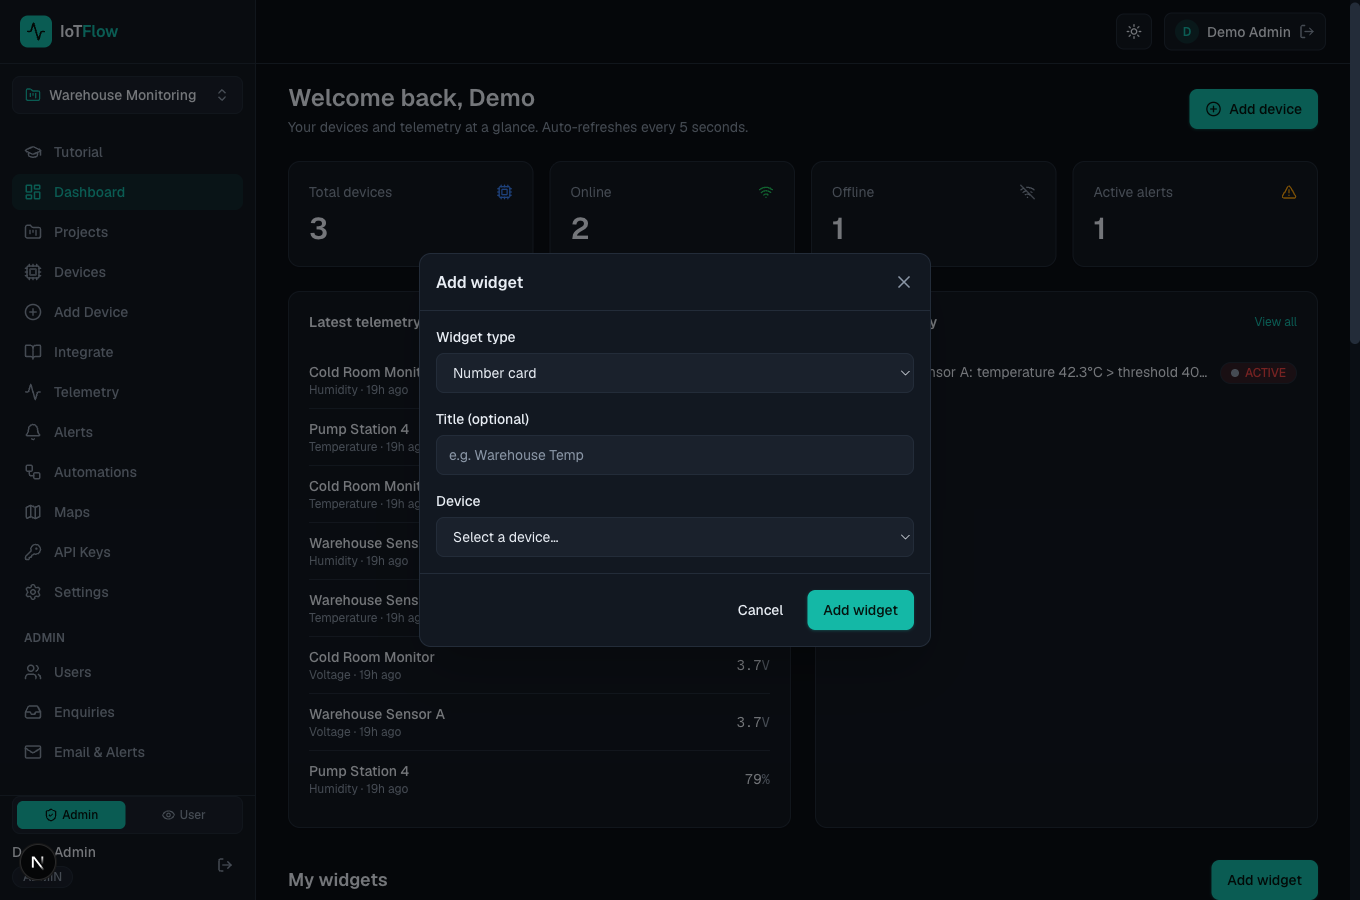
Choosing a widget type — Display and Control groups. - 2
Choose a display type
Pick a Number card, Gauge, Line/Bar chart, LED indicator, Device status, Alert list or Map — whatever suits the reading.
- 3
Bind a device and metric
Select the device and the metric to show (e.g. temperature). For gauges you can set a min and max. Give the widget a title and add it.
- 4
Arrange your dashboard
Add as many widgets as you like — they tile into a responsive grid and refresh automatically. Remove one with the trash icon on its card.
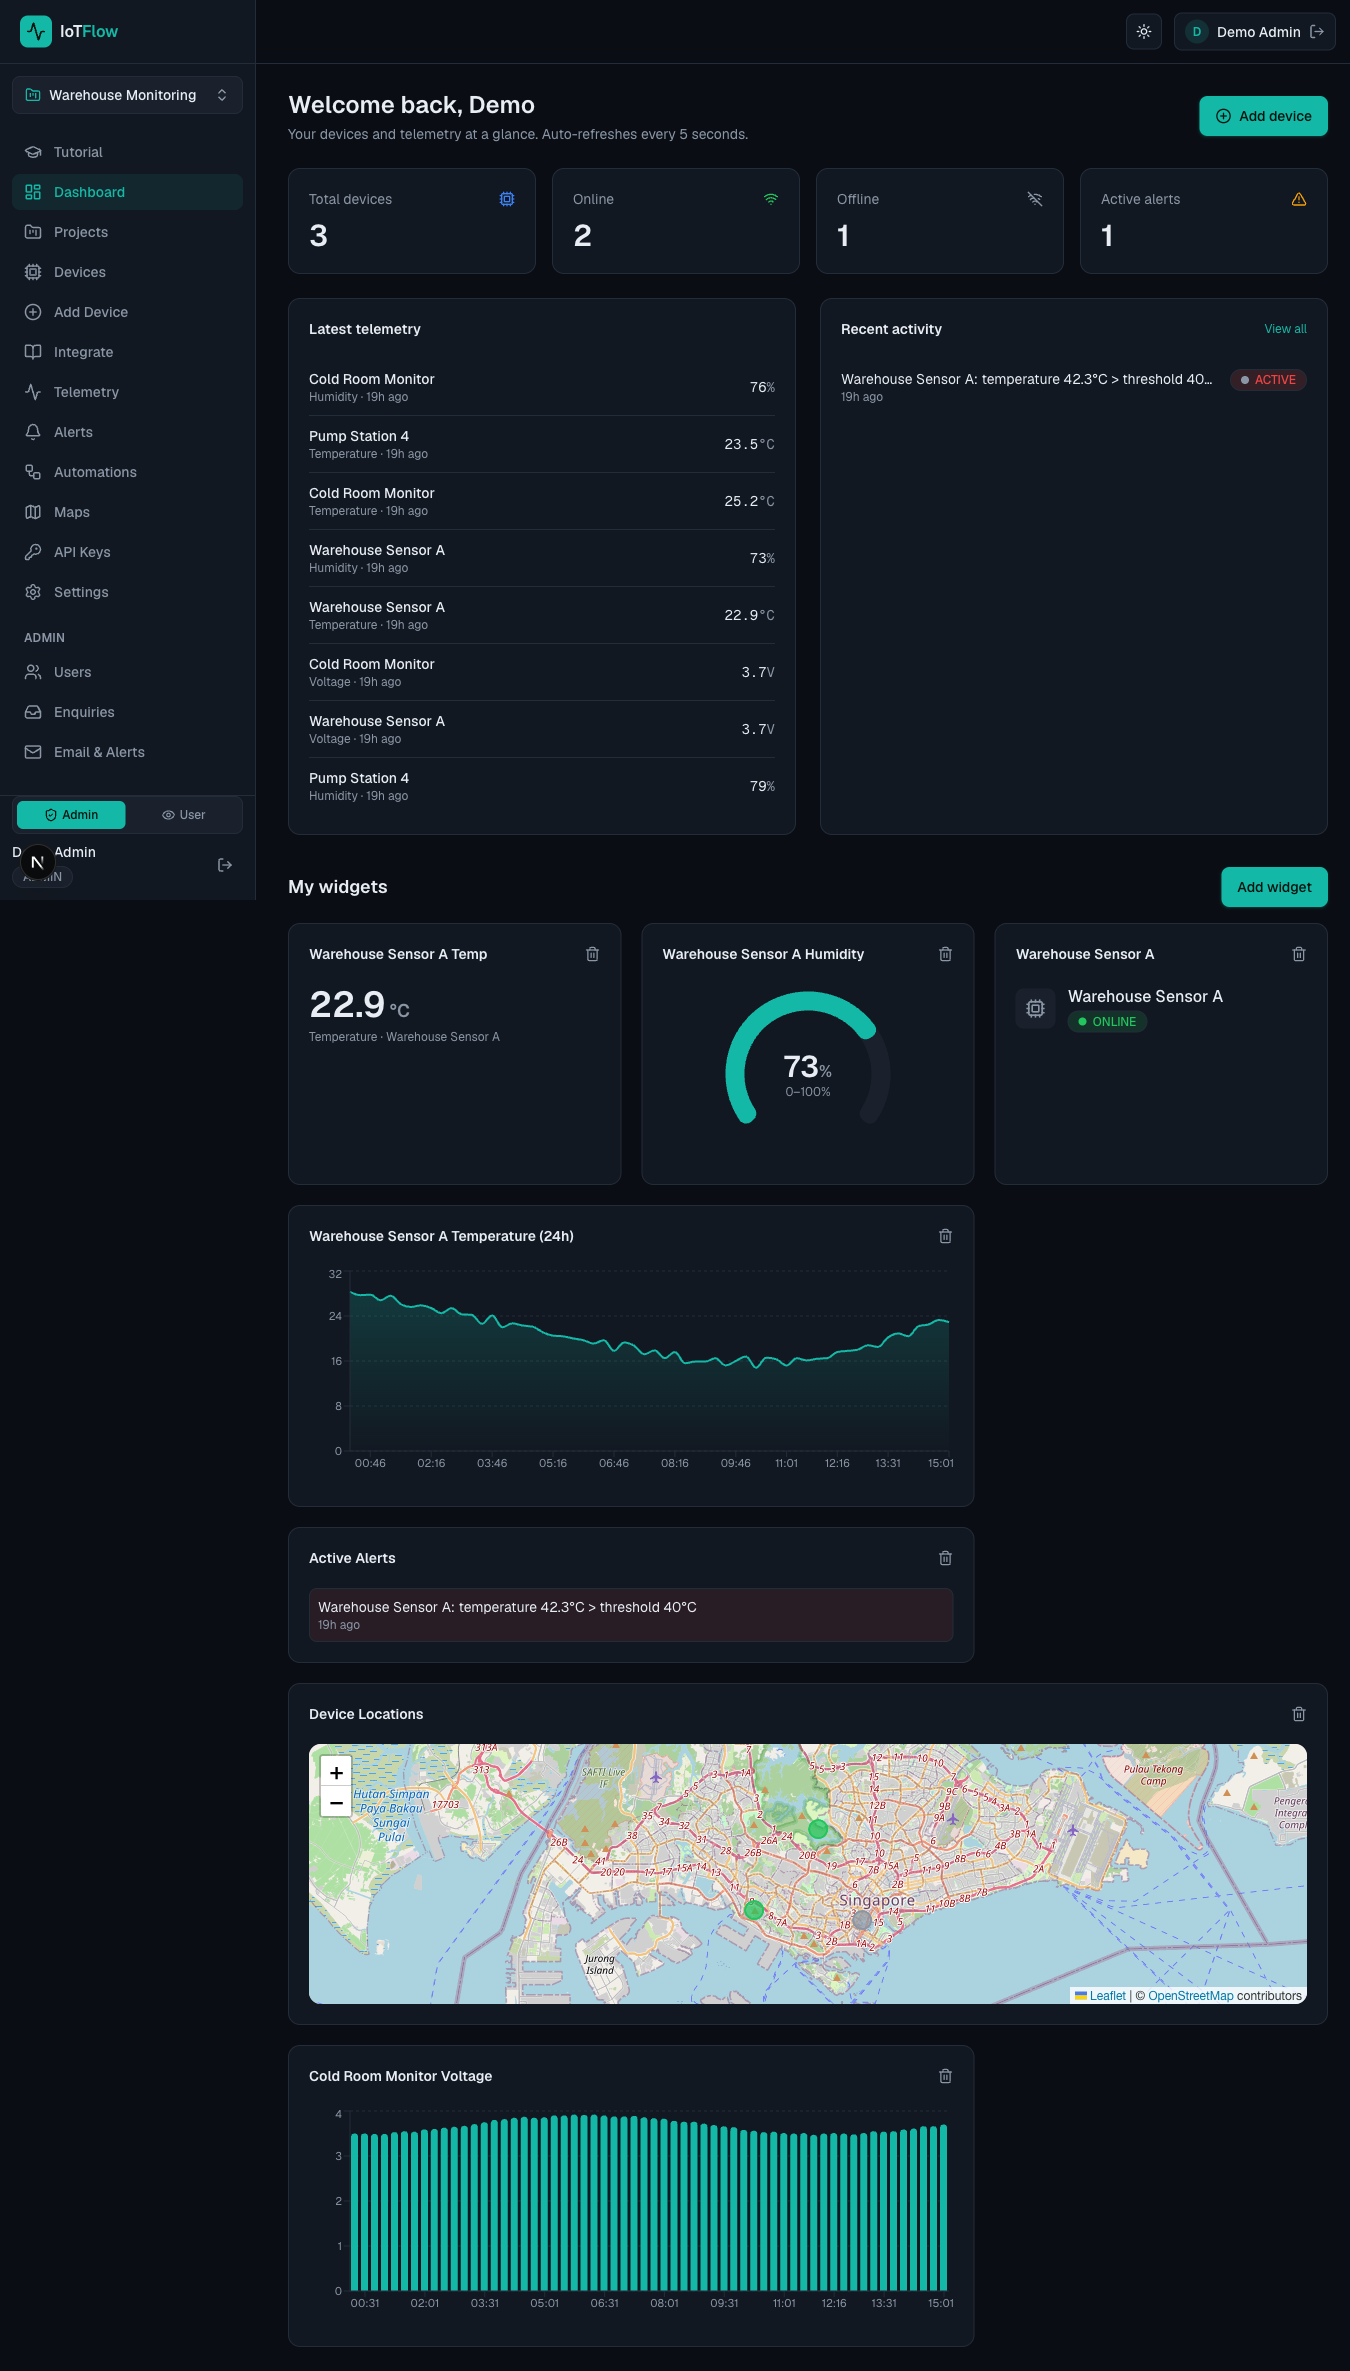
A live dashboard with number, gauge, chart, status, alerts and map widgets.